Characterized electrochemical SARS-CoV-2 interaction using CV and LSV techniques.
Obtained electrochemical parameters from coronavirus interaction with nickel electrode.
Evidence for increase in hydroxide ions when SARS-CoV-2 is present has been produced.
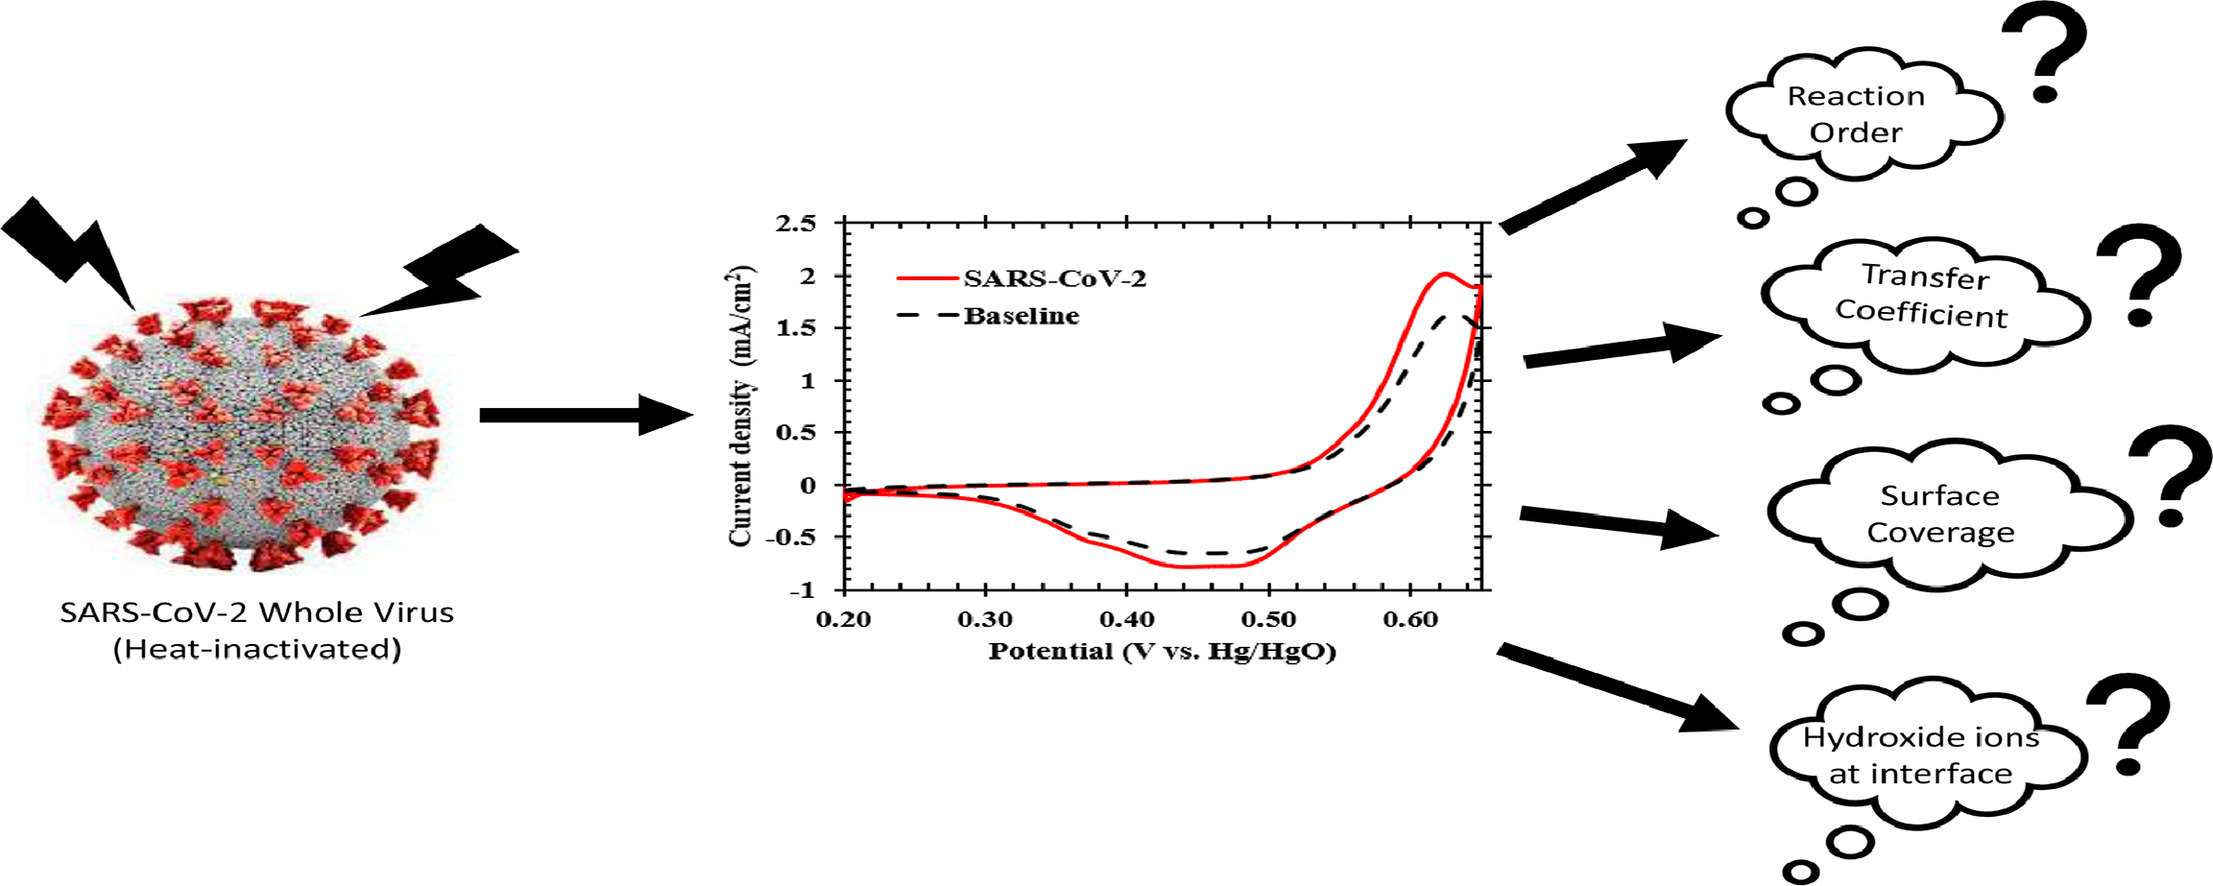
Electrochemical pathogen sensing has gathered limelight for its effective and ultrafast detection capabilities. More recently, several electrochemical sensors were developed to counter the increasing testing requirement for the 2019 coronavirus disease (COVID-19) diagnosis. One such sensor developed was the Ultrafast COVID-19 (UFC-19) diagnostic sensor which could detect the SARS-CoV-2 spike protein in saliva samples. Although UFC-19 was established in literature to sense SARS-CoV-2 in saliva samples, the factors causing such an interaction or parameters to model such an interaction are yet to be studied in detail. In this work, an attempt has been made to electrochemically characterize the interactions at the interface by employing cyclic and linear sweep voltammetry on a rotating disk electrode setup. As a result, electrochemical parameters were calculated using chemical and electrochemical principles. The electrochemical surface area, electrode surface coverage, diffusion coefficient, reaction order with respect to SARS-CoV-2 whole virus, electron transfer coefficient have been estimated providing additional insights into the events occurring at the electrical double layer. The reaction order for the interaction was reckoned to be 0.7 confirming a non-elementary, multi-step process occurring at the interface. Theoretical and experimental calculations confirm higher hydroxide ion accumulation at the interface in the presence of SARS-CoV-2 whole virus. Results from this work lay the foundation for developing models for electrochemical SARS-CoV-2 interaction and possible extension toward other pathogenic viruses.
Electrochemical COVID-19 diagnosis; Electrochemistry of spike protein; Electrochemical characterization; Electric double-layer; SARS-CoV-2 detection; Nickel SARS-CoV-2 interface
Early identification of an infection is of utmost importance to curb the spread of a contagious epidemic into a pandemic. Conventional diagnostic tests based on molecular methods such as polymerase chain reaction (PCR) or other nucleic acid amplification tests (NAATs) have rendered identification and subsequent curtail of infection during outbreaks in the past [1,2]. However, the emergence of COVID-19 has underlined the importance for contemporary rapid tests to meet the testing demand in case of pandemic [3]. These rapid tests typically target the antigen or antibody of the analyte. Between these, antigen tests have proven to be more effective against early infections as antibodies take time to be generated after the onset of infection [4].
Numerous antigen tests based on different detection principles such as lateral flow, fluorescence, colorimetry, electrochemical etc. have been developed [5], [6], [7], [8]. A notable class of biosensors from these are the electrochemical biosensors gaining attention for their ability to sensitively and specifically detect SARS-CoV-2 even after being miniaturized and used for point-of-care applications [8]. Most of these electrochemical pathogen sensors rely on a biorecognition element like enzyme or antibody attached to the electrode surface for detection. Nonetheless, such immobilization suffers due to non-uniformity [9], batch variability [10], and inconsistent performance in the field where conditions are not controlled [11].
To overcome such shortcomings, an ultrafast COVID-19 (UFC-19) diagnostic sensor relying on electrochemical principles for SARS-CoV-2 antigen detection was developed and tested in saliva, water, and air samples [12], [13], [14], [15]. The highlight of this sensor is its ability to form an electrocatalyst locally and detect SARS-CoV-2 without having the need to immobilize any biorecognition element. Though this sensor has been tested successfully with real SARS-CoV-2 samples, there is still obscurity pertaining to the underlying mechanism of detection. A hypothesis for the mechanism has previously been reported where it is believed that the interaction of SARS-CoV-2 antigen is analogous to that of the electrostatic interaction between the positively charged hydrogen occupancies of S1 spike and the negatively charged angiotensin converting enzyme 2 [12]. However, quantitative evidence for such ion movement and concentration changes at the interface affecting the local pH is yet to be found.
Meanwhile, there are limited studies in literature that focus on modeling electrochemical pathogen sensors and the important parameters required in doing so [16], [17], [18]. The advent of emerging pandemic pathogens has emphasized the need to adapt quickly and detect them, apart from detecting variants of existing pathogens. By doing so, we are one step ahead and prepared for any upcoming pandemics. Modeling such interactions can be complex and must be approached in stages. Although the hydrodynamic equations of a rotating disk electrode (RDE) are well studied [19], parameters to model an interface where SARS-CoV-2 interacts with the electrode are yet to be calculated.
Hence, in this paper, focus is laid on electrochemically characterizing the SARS-CoV-2 interaction using an RDE setup to obtain the electrochemical parameters of interest. Moreover, theoretical and experimental calculations were performed to validate the hydroxide ion concentration changes leading to charge accumulation at the electrical double layer. For the first time, to the best of our knowledge, electrochemical parameters resulting from SARS-CoV-2 interaction with electrode in the absence of any biorecognition element has been calculated.
The experimental setup used for experiments reported in this work was the traditional rotating disk electrode (RDE) setup used in our previous work [12]. A nickel disk (AFED050P040NI, 5 mm outer diameter, 4 mm thick, 99.5 %) purchased from Pine Research was used as the working electrode. A platinum (Pt) ring (ESPI metals, 12.5 mm diameter, 0.025 mm thick, 3N5 purity) and mercury/ mercurous oxide (Hg/HgO) electrode (5 mm diameter, 5088 series) purchased from Koslow Instruments were used as the counter and reference electrode respectively. The nickel working electrode was electrochemically aged by running 300 cycles of cyclic voltammetry (CV) between 200 and 650 mV vs. Hg/HgO in 0.1 M potassium hydroxide (KOH) solution (Supelco 61,699, Lot# BCCF7564, prepared with >86 % purity pellets in high purity water and standardized to 0.1 M at 20 °C) at a scan rate of 20 mV/s. A Gamry Reference 600+ potentiostat (Gamry Instruments) was used for all experiments reported in this paper.
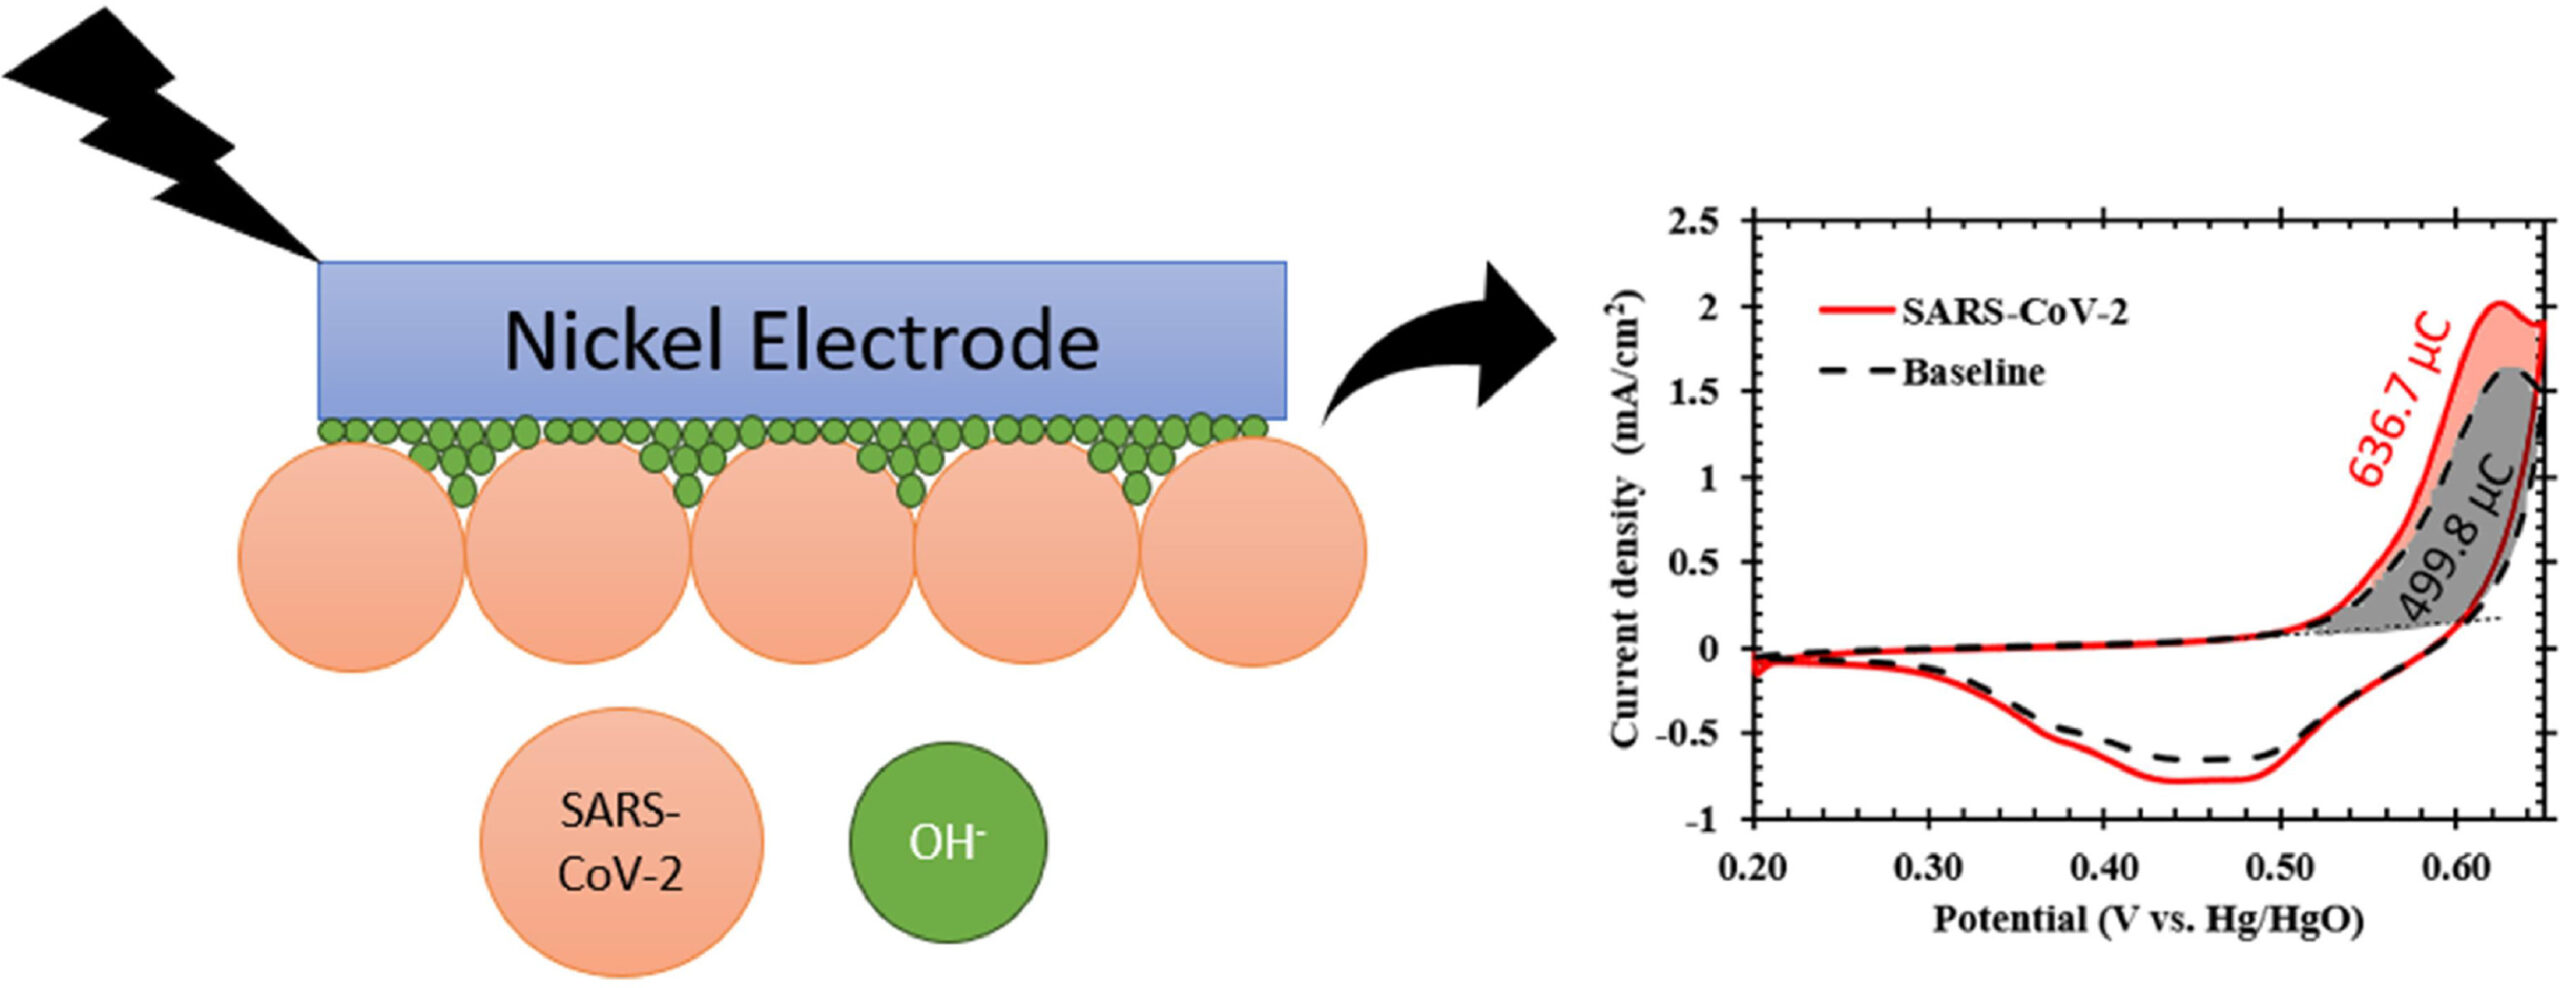
The CV experiments were performed by sweeping the potential between 200 and 650 mV vs. Hg/HgO in the anodic and cathodic regions as previously reported for nickel electrochemical oxidation [20]. Maximum potential used in the range was cut off at 650 mV to prevent water oxidation reaction. Each CV was run for two cycles and the second cycle (sustained periodic state) is reported here. The anodic peak was observed around 580 mV and represents the forward reaction mentioned in Eq. (1). The hydroxide ions from the alkaline electrolyte electrochemically oxidize the nickel hydroxide (chemically formed at the nickel electrode) into nickel oxyhydroxide along with the release of electron. The electron transfer occurring because of the forward reaction is recorded as the anodic peak seen in Fig. 1a. The charge under the anodic peak was thus a representation of the hydroxide ions present at the electrode/electrolyte interface known as the electrical double layer. An increase in the hydroxide ions at interface would increase the charge under the anodic peak resulting in a higher forward reaction rate.
(1)
The maximum accommodable SARS-CoV-2 load on the electrode surface is required to understand the concentration at which the detection would not be physically possible. To obtain this concentration, the maximum number of viruses that can fit within the geometric surface area (SA) is calculated considering that the electrode is planar, and the SARS-CoV-2 virus is spherical in shape [22]. The geometric area of the electrode is 0.196 cm2 and the area of each SARS-CoV-2 virion is 0.785 × 10⁻¹⁰ cm2, by approximating the diameter of SARS-CoV-2 to be 100 nm [23]. Based off these numbers, the maximum accommodable viruses within the area of electrode is about 2.5 × 10⁹ viruses.
Although a physical limit is calculated based of the SA, it is well-known that the electrochemical surface area (ECSA) and corresponding surface coverage could be greater than the geometric area due to factors such as roughness, surface to volume ratio of catalyst on the electrode, etc. [24]. Hence, the electrochemical surface area and electrode surface coverage were calculated using data obtained experimentally to better understand the maximum accommodable SARS-CoV-2 concentration.
The ECSA was calculated experimentally by performing CV at previously described conditions in Section 2.2. The Ni2+/Ni3+ electrooxidation (anodic) peak was used for calculating the charge under the curve experimentally (Q) and dividing it by the theoretical charge density of nickel (q) to obtain ECSA of oxidizable metallic nickel electrode as shown in Eq. (2) [25]. Several records from literature have previously mentioned that the q for nickel electrode is 420 µC/cm2 [25,26]. The charge under the curve as calculated from the anodic peak of Fig. 1a is 499.8 µC. Substituting these values in Eq. (2), the ECSA is calculated as 1.19 cm2. Now, the modified viral load accommodable within the ECSA of electrode is 1.5 × 10¹⁰ viruses. Additionally, the roughness factor (RF) of the nickel electrode used was calculated to be about 6 based on Eq. (3).
(2)
(3)
In addition to calculating the ECSA and the corresponding viral load that could fit within the ECSA, the electrode surface coverage (SC) was calculated. SC is an important parameter used in modeling electrocatalytic systems to understand and mimic the behavior of electrocatalyst interaction with analyte at the operating conditions closely [27]. Laviron theory is typically used for calculating the SC (Γ*) and is given by Eq. (4) [28], where Ipa is the peak anodic current, n represents the number of electrons exchanged during the Ni2+/Ni3+ electrochemical oxidation, F is the Faraday’s constant, R is the ideal gas constant, T is the ambient temperature in kelvin, v is the scan rate of potential sweep. A plot of Ipa vs. v, is shown in Fig. 1b whose slope is used for calculating the electrode SC. The SARS-CoV-2 concentration used for this experiment was 3.9 × 10⁴ cp/mL. The value of SC thus calculated using Eq. (4) is 2 × 10⁻⁷ mol/cm2.
(4)
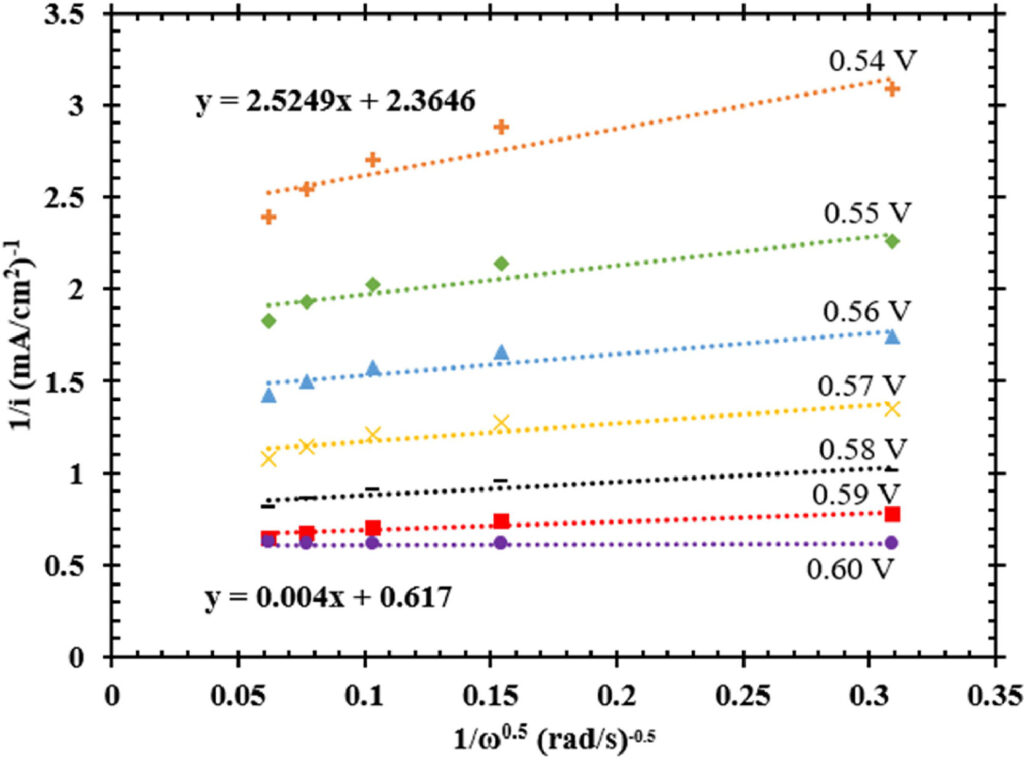
The diffusion coefficient is an important parameter to model the electrochemical system and understand the rate at which an analyte diffuses from bulk to interface for interacting with the electrode. SARS-CoV-2 was estimated to be a spherical shape virus and its diffusion coefficients in different media such as water, soil, tissue were calculated previously using the Stokes–Einstein equation shown in Eq. (5) [29]. Here D represents the diffusion coefficient, kB is the Boltzmann constant, T is the temperature in kelvin, η is the viscosity and d is the diameter of diffusing species. For using UFC-19, it is important to understand the diffusion coefficient of SARS-CoV-2 in media such as KOH and saliva. The kinematic viscosity for KOH and saliva (fresh, unstimulated) are 1.01 and 1.40 cSt [30] respectively, while their densities are 1 g/mL and about 1.007 g/mL [31,32] respectively. The dynamic viscosities of KOH and saliva thus calculated and used for diffusion coefficient determination were 1.01 cP and 1.41 cP. As previously considered, the SARS-CoV-2 diameter used for these calculations was 100 nm [23]. Using these values, the diffusion coefficients of SARS-CoV-2 in KOH and saliva were 4.3 × 10⁻⁸ cm2/s and 3.1 × 10⁻⁸ cm2/s respectively at 298 K.
A comparison between a CV of baseline sample containing only 0.1 M KOH and another sample containing SARS-CoV-2 at a concentration of 3.9 × 10⁴ cp/mL was made to understand the root-cause for an increase in current response. The hypothesis behind this test is that the SARS-CoV-2 S1 spike protein containing hydrogen occupancies move to the double layer upon applying nickel electrochemical oxidation potential and interact with the electrode surface [12]. As an extension to this hypothesis, it is also believed that hydroxide ions facilitate this interaction between the cationic hydrogen occupancies of spike protein and anionic deprotonated nickel electrocatalyst [34] by following a Bockris–Devanathan–Muller double layer model [35]. The resulting interaction is a quasi-specific adsorption onto the electrode which is the basis for the Tafel analysis and transfer coefficient calculations performed in this work. As a result of these charge movements when a potential is applied, the hydroxide ions surrounding the SARS-CoV-2 virions were trapped at the interface between the SARS-CoV-2 virions and electrode surface. This increased hydroxide ion activity near the electrode results in an increase in current response when SARS-CoV-2 is present in the sample. A similar behavior has previously been reported when a nickel electrode coated with graphene in a 2 M KOH electrolyte exhibited higher charge accumulation at the interface in comparison to bare nickel in 5 M KOH [36].
To further prove the above-mentioned events at the interface, a random closed packing of the SARS-CoV-2 virions against the electrode surface was assumed. While the packing density for such an assumption was 63.4 % [37,38], the void fraction has been calculated in literature to be approximately 38 % [39]. If the hypothesis of hydroxide ions being trapped in these voids at the interface is correct, the theoretical and experimentally calculated number of hydroxide ions at the interface should be same or close to each other. Using the void fraction of the packing, the void area of ECSA was calculated to be 0.45 cm2. Now, based on the hydroxide ion radius of 153 pm [40,41], area of each hydroxide ion was calculated to be 7.35 × 10⁻¹⁶ cm2. Theoretically, 6.12 × 10¹⁴ hydroxide ions could fit within the void area.
Theoretical and experimental calculations were performed in this study to estimate the values of several important electrochemical parameters involved in the electrochemical interactions of SARS-CoV-2 with nickel electrode. These parameters are the base for building electrochemical models to detect other existing and emerging genetically modified viruses in the near future. Factors like ECSA, surface coverage can be controlled by using different electrode geometries during simulations to better understand the electrochemical interactions resulting from different pathogens and improve corresponding current sensitivities [27]. The diffusion coefficient becomes a critical parameter while modeling such interactions in different media. Some of these studies have previously been performed in other biosensors targeting certain reaction by-products [42].
Apart from calculating the mass transport and kinetic parameters, it was also proved from this study that the hydroxide ions facilitate the interaction between SARS-CoV-2 and the nickel electrocatalyst. The sharp increase in hydroxide ions at the interface when SARS-CoV-2 is present in the sample also confirms the reason for an increased current response compared to baseline. The events occurring at the electrical double layer indicate that the sensor performance can be controlled by engineering the electrode-pathogen interaction. This is a paradigm shift in the understanding of electrochemical interactions of pathogenic viruses and could lead to new avenues springing in the field of electrochemical drug delivery, a field that has been gaining attention lately.
This detection mechanism could also be valid for detecting similar and related viruses like SARS-CoV and MERS-CoV [15] while it is the opposite for viruses like influenza, human immunodeficiency virus, and bacteria like E. coli and S. aureus [15,43]. Future studies should focus on evaluating the response of the sensor toward other pathogenic viruses to understand the type of viruses which could respond to the device. The work performed in this study lays the foundation that could be expanded to determining the electrochemical parameters for modeling electrochemical systems detecting other responsive pathogens. The fact that the current intensities of different viruses vary even when they are at the same concentration [15] opens the possibility to detect them specifically and sensitively by precisely controlling the reaction at the interface based on their differing hydrogen occupancies [44] or by modifying the electrode material, size, and structure [16,45] to control the number of reacting hydroxide ions.
The authors declare the following financial interests/personal relationships which may be considered as potential competing interests:
Authors G.G.B. and A.R. are co-inventors of the Ultra-Fast COVID-19 detection technology (rapid viral diagnostic sensor, US11060995B1, 2021). G.G.B. has ownership on EviroTech LLC (non-publicly traded entity) that has acquired a license from Texas Tech University to commercialize the rapid viral diagnostic sensor.
[21]
Experience the future of HIV-I diagnosis – simpler, faster, and more accessible than ever before.